FDI Inflow to Turkey (USD billion)
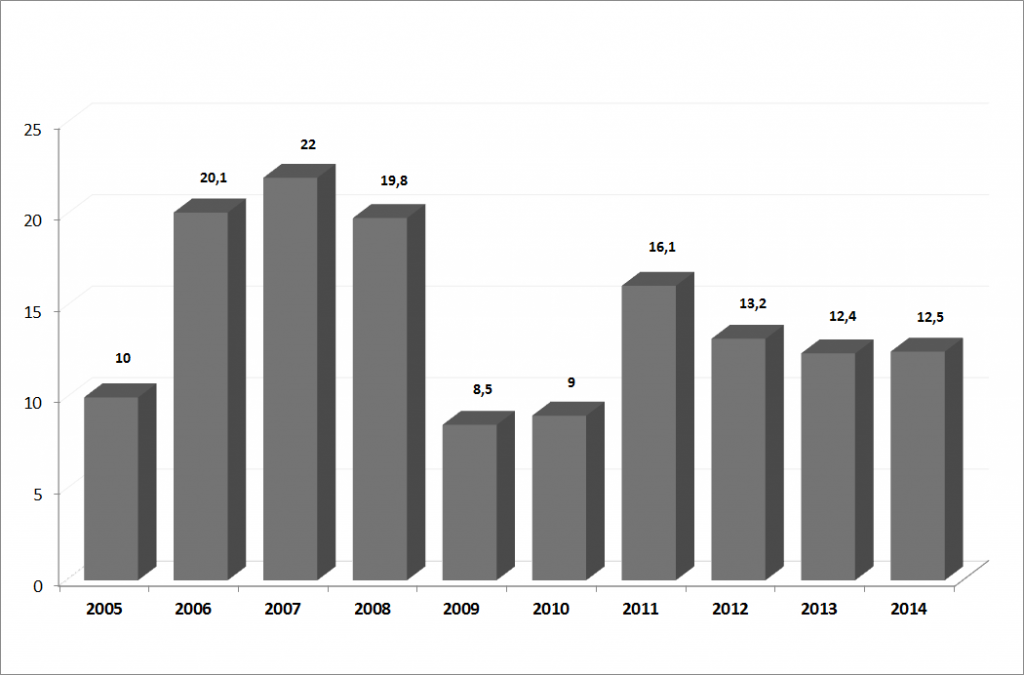
Source: Central Bank of the Republic of Turkey
FDI Inflow to Turkey by Year
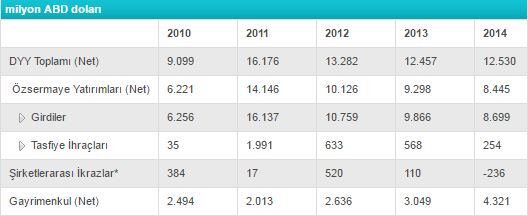
*Loans that companies with foreign capital are given by foreign partners
Source: Central Bank of the Republic of Turkey
FDI Inflow to Turkey by Sector
During the last five years, the intermediation and manufacturing sectors have attracted the highest amount of FDI.
|
USD million |
|||||
| Sectors |
2010 |
2011 |
2012 |
2013* |
2014* |
| Agriculture |
81 |
32 |
43 |
47 |
61 |
| Agriculture, forestry and fishing |
81 |
32 |
43 |
47 |
61 |
| Industrial sectors |
2,887 |
8,038 |
5,480 |
4,819 |
4,666 |
| Mining and quarrying |
136 |
146 |
213 |
242 |
449 |
| Manufacturing |
924 |
3,597 |
4,343 |
2,207 |
2,891 |
|
124 |
650 |
2,201 |
400 |
557 |
|
94 |
148 |
376 |
60 |
139 |
|
0 |
0 |
0 |
0 |
1 |
|
1 |
0 |
84 |
3 |
0 |
|
18 |
74 |
12 |
107 |
90 |
|
3 |
1,255 |
179 |
236 |
100 |
|
120 |
348 |
579 |
272 |
495 |
|
7 |
128 |
486 |
168 |
75 |
|
54 |
37 |
10 |
29 |
158 |
|
213 |
292 |
101 |
100 |
129 |
|
64 |
76 |
32 |
5 |
4 |
|
177 |
464 |
143 |
607 |
918 |
|
38 |
93 |
121 |
97 |
124 |
|
11 |
32 |
19 |
123 |
101 |
| Electricity, gas, steam and air-conditioning supply |
1,824 |
4,293 |
924 |
2,334 |
1,323 |
| Water supply, sewerage, waste management and remediation |
3 |
2 |
0 |
36 |
3 |
| Services |
3,288 |
8,067 |
5,236 |
5,000 |
3,972 |
| Construction |
310 |
301 |
1,427 |
178 |
232 |
| Wholesale and retail trade |
435 |
709 |
221 |
377 |
1,165 |
| Transportation and storage |
183 |
222 |
130 |
300 |
136 |
| Accommodation and food service activities |
113 |
122 |
16 |
59 |
20 |
| Information and communication services |
36 |
36 |
133 |
110 |
212 |
| Financial and insurance activities |
1,621 |
5,883 |
2,084 |
3,415 |
1,535 |
|
835 |
4,745 |
1,500 |
1,608 |
1,018 |
|
766 |
882 |
348 |
1,538 |
120 |
|
10 |
170 |
176 |
229 |
262 |
|
10 |
86 |
60 |
40 |
135 |
| Real estate activities |
241 |
300 |
173 |
128 |
227 |
| Professional, scientific and technical activities |
94 |
103 |
78 |
87 |
94 |
| Administrative and support service activities |
17 |
55 |
234 |
175 |
93 |
| Public administration and defense, compulsory social security |
0 |
0 |
0 |
0 |
0 |
| Education |
17 |
68 |
60 |
2 |
0 |
| Human health and social work activities |
112 |
232 |
546 |
106 |
200 |
| Arts, entertainment and recreation |
62 |
13 |
81 |
5 |
2 |
| Other service activities |
47 |
23 |
53 |
58 |
56 |
| Activities of households as employers; undifferentiated goods--and-service-producing activities of households for own use |
0 |
0 |
0 |
0 |
0 |
| Activities of extra-territorial organizations and bodies |
0 |
0 |
0 |
0 |
0 |
| Total |
6,256 |
16,137 |
10,759 |
9,866 |
8,699 |
(*) Provisional
Source: Central Bank of the Republic of Turkey
Geographic Breakdown of FDI Inflow to Turkey
The majority of FDI inflows to Turkey come from Europe, North America, and the Gulf countries.
|
USD million |
||||||
|
2009 |
2010 |
2011 |
2012 |
2013* |
2014* |
|
| Europe |
5,248 |
4,939 |
12,588 |
7,925 |
6,400 |
6,566 |
| Developed Europe |
4,942 |
4,737 |
11,495 |
7,303 |
5,272 |
5,512 |
| EFTA countries |
281 |
197 |
323 |
592 |
234 |
324 |
| Other European countries |
25 |
5 |
770 |
30 |
894 |
730 |
| Africa |
2 |
0 |
0 |
0 |
221 |
42 |
| North Africa |
1 |
0 |
0 |
0 |
0 |
0 |
| Other African countries |
1 |
0 |
0 |
0 |
221 |
42 |
| America |
331 |
384 |
1,485 |
491 |
343 |
325 |
| North America |
312 |
378 |
1,423 |
471 |
342 |
325 |
| Central America |
12 |
0 |
57 |
16 |
1 |
0 |
| South America |
7 |
6 |
5 |
4 |
0 |
0 |
| Asia |
673 |
928 |
2,055 |
2,337 |
2,899 |
1,766 |
| Near and Middle Eastern countries |
361 |
473 |
1,558 |
1,593 |
2,286 |
1,231 |
| Arabian Gulf countries |
209 |
388 |
195 |
940 |
880 |
425 |
| Other Near and Middle Eastern countries |
78 |
45 |
1,359 |
653 |
1,406 |
788 |
| Other Asian countries |
312 |
455 |
497 |
744 |
613 |
535 |
| Oceania and polar regions |
12 |
5 |
9 |
6 |
3 |
0 |
| Unclassified |
0 |
0 |
0 |
0 |
0 |
0 |
| Total |
6,266 |
6,256 |
16,137 |
10,759 |
9,866 |
8,699 |
(*) Provisional
Source: Central Bank of the Republic of Turkey
Companies with International Capital
As of 2014, more than 39,100 companies with foreign capital operate in Turkey.
Number of Companies with International Capital
(Cumulative, in thousands)
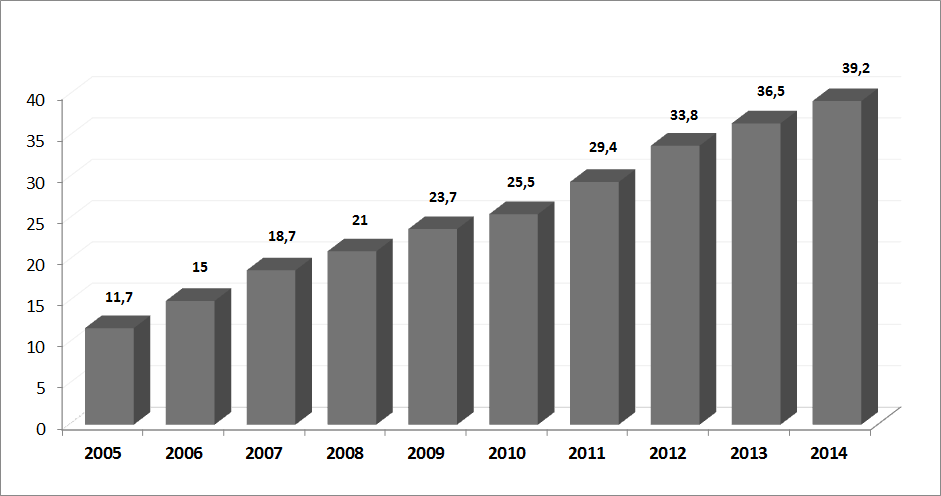
Source: Ministry of Economy
www.invest.gov.tr